Building UX Research at Montefiore Health System
Establishing foundational UX research practices at a $6B academic medical center, from designing research operations to mapping multi-stakeholder care journeys that informed digital product strategy.

The Challenge
How do you establish patient-centered research at a $6B healthcare system that has never had a UX research practice, while navigating HIPAA constraints, no participant access, and siloed workstreams?
Montefiore Health System serves 3.4 million patients across the Bronx and Hudson Valley. I joined as the first dedicated UX researcher, reporting to the Director of Digital Health Product. Digital products were being built based on internal assumptions with no formal research practice, no participant access, and HIPAA/compliance constraints blocking patient engagement.

Approach
Philosophy: “Act Fast, Think Long”
I designed a phased research strategy that delivered quick wins to build credibility while constructing long-term infrastructure for sustainable impact.
| Phase | Timeline | Methods | Key Outputs |
|---|---|---|---|
| Immediate | Weeks 1 to 4 | Expert reviews, competitive analysis | Provider Directory assessment, Top 10 Research Questions |
| Short-term | Weeks 5 to 12 | Systems analysis, internal panel building | 13 specialty flow analysis, UXR Recruitment Playbook |
| Medium-term | Weeks 13 to 24 | Proto-personas, journey maps, stakeholder interviews | 6 service blueprints, persona validation, October workshop |
| Long-term | Weeks 25 to 33 | Data-backed synthesis, AI repository | Quantitative analysis, automated repository, Q1 2026 program |

Research Operations Infrastructure
Building sustainable research required more than methods. I developed a complete research operations system including HIPAA-compliant recruitment pathways, tool recommendations at three price points, and an AI-powered document repository.

Research in Action
The research program generated a rich source of truth connecting insights across multiple care programs, stakeholder interviews, and quantitative datasets. Weekly dashboards maintained transparency while journey maps and service blueprints created shared understanding across product, clinical, and operational teams.

Key Findings
Quantitative analysis of breast cancer screening outreach revealed the majority of non-completing patients were never contacted. 31% were unreachable and 11.5% were ineligible before a call was ever made. The problem was data quality upstream of the first call, not patient willingness.
What the Data Revealed
- Unreachable patients: 31% of the outreach list had wrong numbers or disconnected lines
- Ineligible patients: 11.5% were already screened, moved, or deceased
- Conversion with contact: Approximately 75% of patients completed scheduling once two-way contact was established
- Scheduler heroics: Navigators compensated for system gaps using shadow tracking spreadsheets
- 12,000+ outreach records analyzed across 6 sites and 4 channels
Product Requirements from Research
Findings produced three Q1 2026 product requirements, each traced to an observed issue:
- Patient identification report in Epic reporting workbench: traced to navigators maintaining shadow tracking spreadsheets because the EHR did not surface the right patient lists
- Auto-eligibility order refresh for MyChart self-scheduling: traced to 11.5% of the outreach list consumed by patients who were already screened, moved, or deceased
- Unified clinical results workflow: traced to patients receiving results through inconsistent channels depending on which site performed the procedure

Impact
Research Infrastructure Delivered
- Service blueprints and process maps across six clinical programs synthesized into an Aggregate Service Blueprint using a Four-Layer framework
- 8 role-based personas scored across 7 dimensions with 11 shared JTBD that converted into product requirements
- UXR Recruitment Playbook complete (HIPAA-compliant)
- Tool evaluation with recommendations at 3 price points
- AI-powered research repository using Microsoft Power Automate and Azure OpenAI GPT 4o
- Q1 2026 product program designed across multiple care programs

Service Blueprints
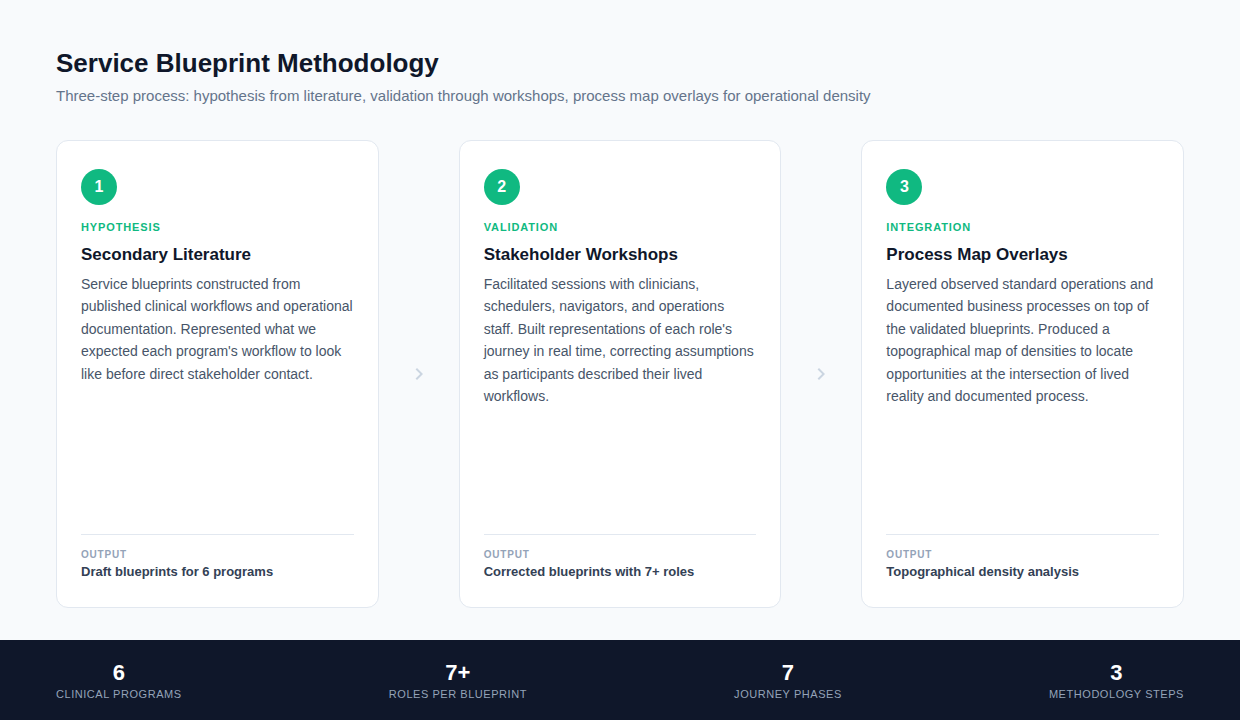
Quantitative analysis identified where patients fell out but could not explain why. Operational workflows were undocumented. The blueprint methodology started from secondary literature as a hypothesis, tested those blueprints against lived experience in stakeholder workshops, then layered process maps on top to produce a topographical view of operational density.
Method
Six clinical programs needed a common framework that could be standardized across care journeys. The question was how to show the details of each role’s needs while maintaining a system-wide view of all roles and journeys in context of one another.
Designed and facilitated stakeholder workshops with clinicians, schedulers, navigators, and operations staff. Built representations of each role’s journey in real time as participants described their workflows, correcting assumptions on the spot. Process map overlays combined observed standard operations and documented business processes, producing a view where the differences between lived reality and documented process were visible.
Findings
Blueprints exposed shadow systems compensating for EHR gaps, site-level variation (Bronx relational flexibility vs. Westchester rigid checklists), referral routing failure points, and logistics bottlenecks. Process map overlays gave a view of where operational density clustered, indicating both duplication and invisible labor.
Key metrics: 6 programs | 7+ roles per blueprint | 7 journey phases | Process map overlays for CRC and WM/BarSurg
Cross-Journey Synthesis
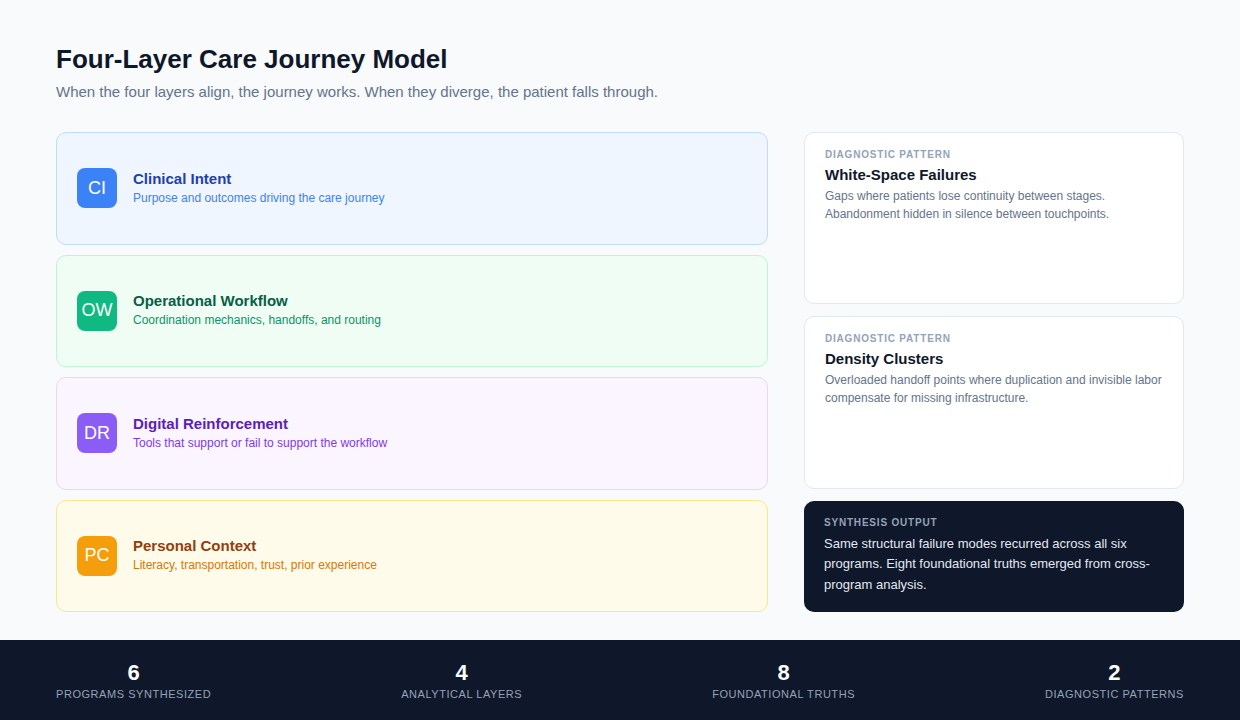
When Clinical Intent, Operational Workflow, Digital Reinforcement, and Personal Context align, the journey works. When they diverge, the patient falls through. This model crystallized during synthesis of six program-level blueprints into a unified cross-journey view.
Method
Individual program blueprints revealed local failure patterns. Viewed in isolation, each appeared unique. Six blueprints, a set of personas, and stakeholder data existed as separate artifacts. The task was to synthesize them into a unified cross-journey view for system-level product evaluation.
Constructed the Aggregate Service Blueprint mapping all roles across all stages. Developed a topographical analysis identifying two diagnostic patterns: white-space failures (gaps where patients lose continuity between stages) and density clusters (overloaded handoff points where duplication and invisible labor compensate for missing infrastructure). Cross-referenced role burden across programs.
Findings
Same structural failure modes recurred across all six programs. Eight foundational truths emerged from cross-program analysis, covering patterns including white-space failures hiding abandonment, density failures hiding duplication debt, invisible labor holding care together without infrastructure, equity multiplying every flaw, and business impact hidden in operational noise.
Synthesis of needs and pain points into jobs-to-be-done gave the product team actionable units that were converted into product requirements and a Q1 2026 product program.
Key metrics: 6 programs synthesized | 8 foundational truths | Four-Layer framework | Aggregate Service Blueprint | 5-act narrative

Research Function Build: 0 to 1
No prior UX research practice existed. One researcher. No design function. No direct participant access. HIPAA constraints. Leadership needed visible returns within the first quarter. The strategy delivered quick wins to build credibility while constructing long-term infrastructure for sustainable impact.
Strategy
Designed a four-phase research strategy calibrated to the conditions. Immediate phase (Weeks 1 to 4): expert reviews and competitive analysis producing quick wins. Short-term (Weeks 5 to 12): systems analysis and participant pipeline development. Medium-term (Weeks 13 to 24): journey research, stakeholder workshops, and persona validation. Long-term (Weeks 25 to 33): quantitative analysis, AI repository, and Q1 2026 program design.
Research Operations
Defined the full research operations process from intake through archiving. Created a 5-action intake routing system (kick-off now, backlog, next sprint, spike, or decline). Evaluated tools across three procurement tiers (enterprise, mid-market, open source) and developed a UserZoom GO business proposal ($250/month) as the minimum effective tool: the smallest investment that would expand methods beyond surveys and moderated interviews.
One gap between what was available and what the program needed drove development of the AI-powered research repository using Microsoft Power Automate and Azure OpenAI GPT-4o.
Result
Delivered usable outputs at each phase. Quick wins generated the evidence that justified the infrastructure investment. Q4 quarterly update credited the research function with building product domain from 0 to 1.
Key metrics: 4 phases | 5 maturity dimensions | 6 constraint categories | 5-action intake routing | 3 procurement tiers | $250/month minimum effective tool
Competitive Benchmarking: 286 Booking Flows
Two competing priorities at different levels of the organization. A PM needed a question-level answer: “There are lots of ways our market asks for a patient’s age, what should we ask?” A VP needed a strategic answer: “Can you help us define market parity?” The benchmarking study served both with one body of work.
Method
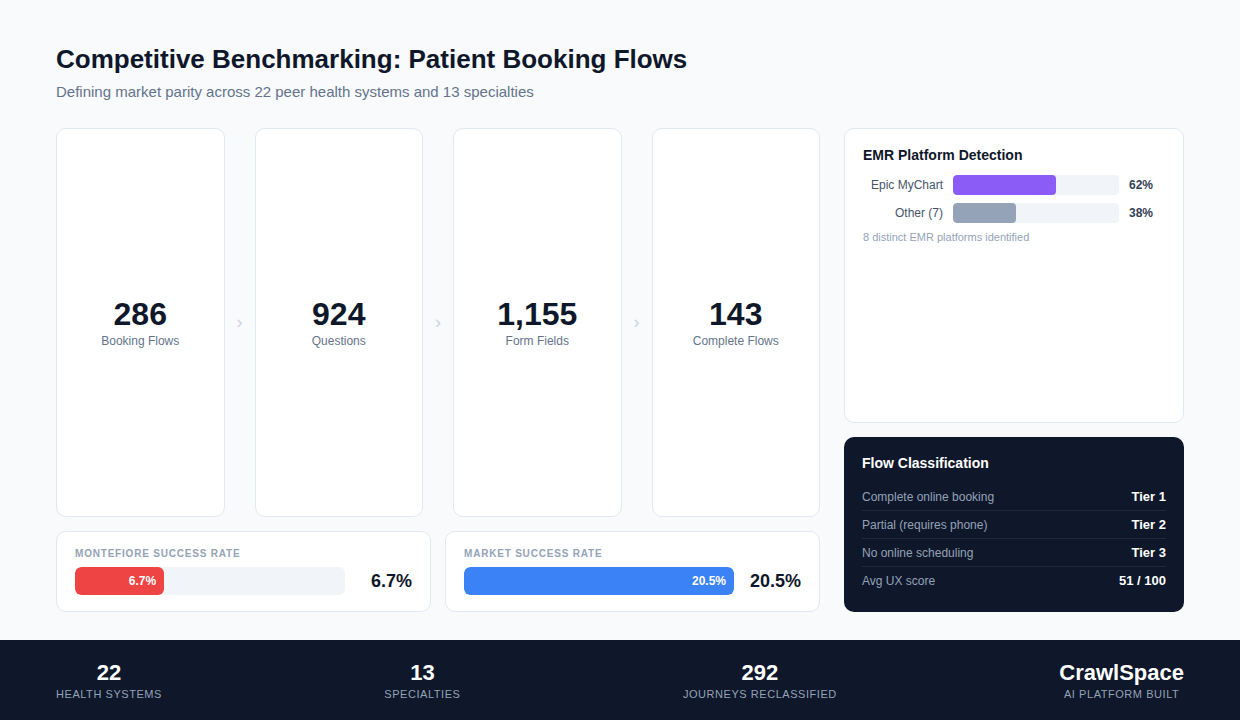
Analyzed the digital properties of 22 peer health systems and their patient booking flows across 13 specialties. Manually screen-captured all booking flows, then built CrawlSpace, an AI-powered competitive intelligence platform in Replit that automated crawling, screenshot capture, OCR analysis, and comparison across systems. The tool used Playwright for browser automation, detected EMR integrations and shadow DOM components, extracted and classified every booking question by input type, and rendered the data in a React dashboard.
Findings
Catalogued 924 booking questions and 1,155 form fields. Mapped 143 complete flows with step-level detail. Classified each flow into tiers: complete online booking, partial flows (booking starts but requires a phone call to complete), and no online scheduling. Detected EMR platforms across the market: Epic MyChart dominated at 62% of identified systems, with 8 distinct EMR platforms total.
After reclassifying 292 journeys against consistent completion criteria, only 20.5% showed successful end-to-end online booking. Montefiore’s success rate was 6.7%. The average UX score across the market was 51 out of 100, and zero flows met all ideal standards.
Result
Gave the product team a concrete, evidence-based definition of competitive position. The tiered classification showed exactly where Montefiore sat relative to systems like Mayo Clinic and NYU Langone. Design recommendations scoped to specific interaction patterns. Booking flow data became a standing reference for product decisions.
Key metrics: 286 flows | 22 systems | 13 specialties | 924 questions | 1,155 fields | 292 journeys reclassified | 20.5% market vs 6.7% Montefiore | 8 EMR platforms | CrawlSpace AI platform
Reflection
What Worked Well
- Phased approach: Delivering expert reviews and competitive analysis immediately built credibility while longer-term infrastructure was being designed.
- Human-Business-Tech framework: Connecting patient insights to KPIs made research legible to leadership.
- Weekly dashboard: Transparent progress tracking across workstreams maintained stakeholder alignment.
What I Would Do Differently
- Start quantitative analysis earlier: The November BCS analysis revealed actionable patterns that could have informed earlier decisions.
- Engage navigators sooner: Navigator overload emerged as a cross-cutting theme. Interviewing them in Month 2 would have surfaced this faster.
- Build the AI repository in parallel: The automated summarization infrastructure took time. Starting it alongside journey mapping would have created compounding value.